What to Work on Next
You check your analytics every week and walk away without knowing what to do. This session teaches you how to find what's broken and where growth is waiting.
For online business owners who are tired of opening GA4, staring at numbers, and closing the tab without a decision. In 60 minutes plus Q&A, you'll learn the two concepts behind the North Star Framework and start building your actual dashboard before the session ends.
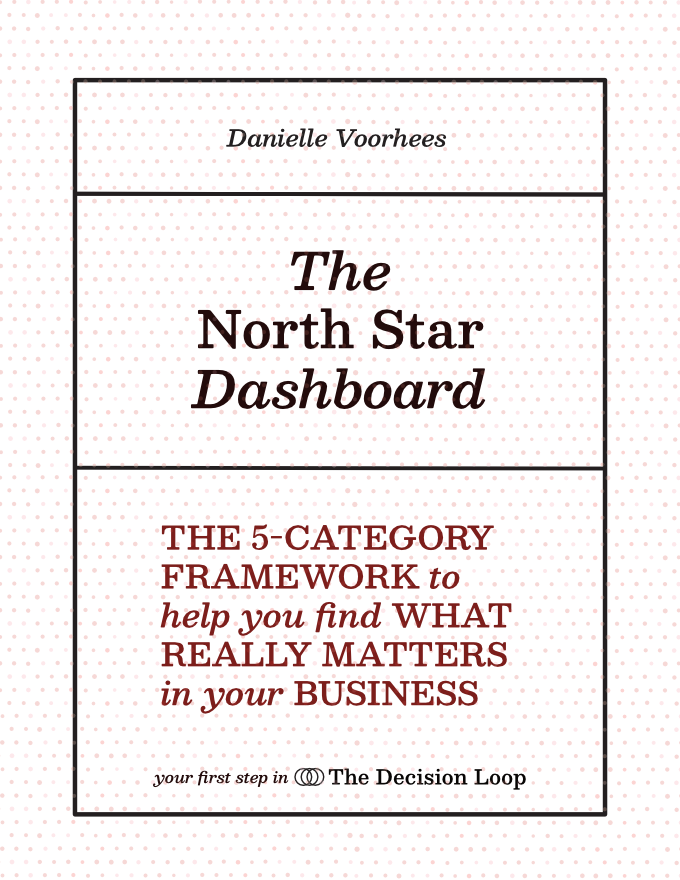
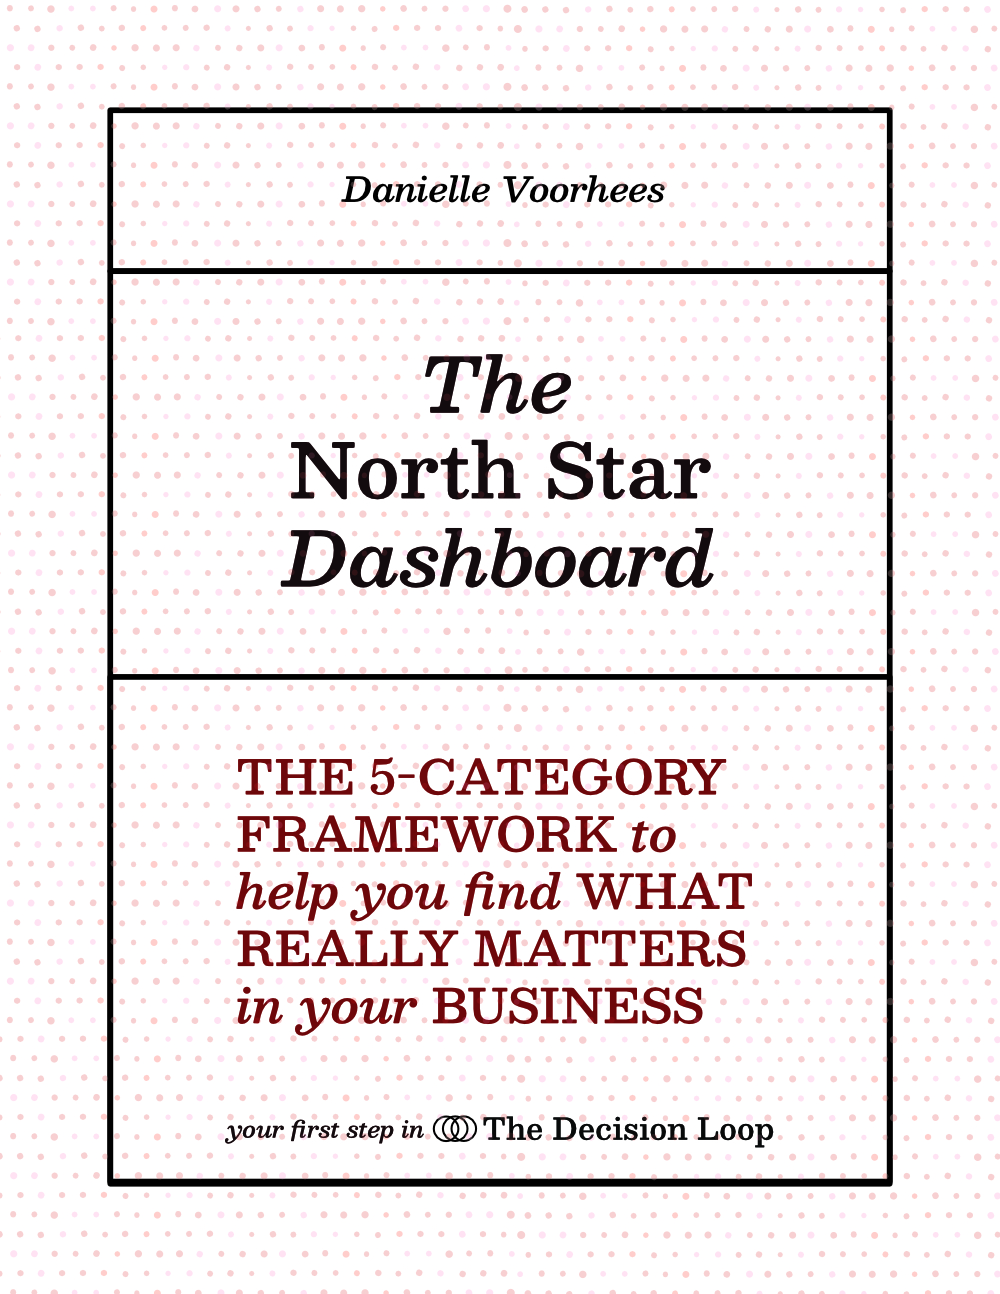
The diagnostic framework. The implementation guide. Together.
110 pages. The implementation system for building a dashboard that maps directly to how your business makes money. Not a generic analytics checklist.
GA4 alone tracks hundreds of things. The guide tells you which 6-8 actually matter for your business model, and why those specific ones, not any others.
E-commerce, SaaS, digital products, lead gen, and 21 more. Find your type, get your metrics.
Find every metric in GA4, Shopify, HubSpot, WooCommerce, and Stripe. No guessing where to click.
Week-by-week plan from metric selection to a dashboard you check every Monday in 5 minutes.
You open GA4. Revenue is down. You have no idea which part of your business caused it.
So you start clicking. Traffic looks okay. Conversion rate is down a bit. But is that the problem, or a symptom of something upstream? Is it your offer, your traffic source, your checkout? You spend an hour in your analytics and walk away with more questions than you started with.
Then someone asks. Your CEO wants to know why revenue is flat. Your client wants to know if the retainer is working. Or you're sitting in your own Monday morning and realizing you've been making decisions by gut for months because the data never tells you anything actionable.
The problem isn't your data. Your metrics are already capturing what's happening. The problem is that nobody showed you how to read them in order, as a chain that leads from symptom to cause to decision.
Reporting tells you revenue is down 12%. Diagnosis tells you it's down because conversion rate dropped, which dropped because traffic quality shifted. Those are three completely different decisions. The same chain works in reverse too. When a metric moves up unexpectedly, the same sequence tells you why, and whether you can push it further.
The North Star Framework gives you the structure to move through that chain. Every time, in about 5 minutes.
- When someone asks why revenue is down, you know exactly what to say and where to look
- You can sit down with Monday's numbers and make a decision, not just a report
- You know which part of your business to fix first, without second-guessing yourself
- You can spot where growth is available, not just where something is broken
- You leave with your North Star metric and 6 diagnostic metrics identified in a Google Sheet, the beginning of a dashboard you'll actually use.
- Your CEO, client, or board asks what the data says and your honest answer is that you're not entirely sure.
- You've increased ad spend without being able to tell whether the last increase actually worked.
- You check your analytics weekly but make most decisions by gut because the numbers don't give you a clear direction.
- You can see traffic is up and revenue is flat but you can't explain why, or what to do about it.
- You've had the guide sitting in your downloads folder and haven't started because you weren't sure where to begin.
This session answers the question you're afraid to say out loud: "I have the data. Why can't I tell what it means?"
- ✗ You've never worked with your existing analytics. This session assumes some familiarity with your data. If you are just getting started with analytics, check out this instead.
- ✗ You're looking for a technical GTM or GA4 implementation session. This is strategic framework, not tag manager configuration.
- ✗ You want a pre-built dashboard handed to you. This session teaches the thinking so you can build and adapt your own.
- ✗ Your business doesn't make money through your website. This is specifically for web-revenue businesses.
Works for e-commerce, SaaS, digital products, lead gen, subscriptions, and 20+ other web-revenue models. The framework adapts to your business type — the guide covers 25 of them specifically.
Two concepts. One build. You leave with a working foundation.
Most workshops end with a full notebook and nothing built. This one ends with your North Star metric identified, a look over the 5-7 diagnostic metrics that could work best for your business model, and the beginnings of a dashboard you can actually use.
The North Star metric for a Shopify store looks nothing like the one for a SaaS subscription or a lead gen business. Part 1 covers how to find yours specifically — and Part 3 is where you do it.
Most dashboards track everything and tell you nothing. A North Star metric is the single number that best represents value delivered to your customer. When it moves, everything downstream eventually follows. We cover what it is, why it's different for every business model, and how to find yours in the guide.
Volume, Quality, Conversion, Value, Efficiency aren't a reporting checklist. They trace the exact path your customer takes through your business. When something breaks in that journey, the category covering that stage tells you first. When something is working better than expected, the same read tells you where the opportunity is and what's driving it.
You open the guide to your business type, identify your North Star metric, and add your 6 diagnostic metrics to a sheet. You're not finishing the dashboard in the session. That's what the 5-Day Intensive is for. But you leave with the foundation built, not just planned.
Plus: live Q&A
Bring your business model, your current metrics, your "I see the number but don't know what to do about it" moments. That's exactly what the Q&A is for.
The diagnostic framework. The implementation guide. Together.
The guide builds your dashboard. The session teaches you how to use it as a diagnostic tool, so every week you're not just reading numbers but identifying the one constraint most worth fixing right now.
The guide is delivered immediately when you register. Read it before the session, follow along during, implement after. That's the sequence that makes this stick.
The why behind the framework, taught live with time for questions specific to your business.
Can't make it live? The recording is yours. Same content, watch on your schedule.
Your specific business model, your specific setup. Bring the questions you've been sitting on.
110-page PDF. The implementation system: 25 business types, metric frameworks, platform instructions.
Daily emails with your next action. Comes with the guide so you can build your dashboard the week after the session.
You leave Part 3 with your North Star metric and 6 diagnostic metrics in a Google Sheet. Not finished. That's what the Intensive is for. But started.
I kept seeing the same thing
I'm Danielle Voorhees, a growth engineer who's worked with SaaS companies, e-commerce brands, and mission-driven organizations. Every engagement started the same way: smart, capable people who had GA4 open, had a dashboard, were checking their numbers regularly, and still couldn't tell me with confidence which part of their business to work on next.
It wasn't that they were bad at their jobs. It was that they'd never been shown how to read their metrics in sequence. They were looking at individual numbers instead of a chain. So everything looked either fine or alarming, and neither feeling led to a decision.
This session teaches the diagnostic approach I use every time I work with a client's data. By the end, you'll use your own dashboard the same way. You'll stop dreading the question "what does the data say?"
Frequently Asked Questions
The guide is included with your ticket. You'll receive it immediately when you register. We recommend reading through your business type section before the session so you can follow along and ask sharper questions during Q&A.
If you've already purchased the guide separately, reach out before registering and we'll make sure you're not double-paying for something you own.
The recording is sent to all registrants after the session. You'll have the guide immediately and the recording within 24 hours. The live Q&A is the one thing you'll miss if you can't attend, but you can send questions in advance and I'll address them during the session.
You need to be comfortable in GA4 at a basic level. You've been in there, you know roughly what it does, you check it occasionally even if it doesn't always make sense. You don't need to be a data analyst or know SQL.
This session is strategic, not technical. We're covering the logic and mental model, not configuring events or building Looker Studio dashboards. If you're the person responsible for making sense of your analytics, this is written for you.
Yes, they're designed to work together, not cover the same ground.
The guide is implementation: here are your metrics, here's how to find them, here's how to build the dashboard. It answers "what."
The session is understanding: here's why these categories exist, how they connect to revenue, what it means when they move. It answers "why." You need both, which is why we include the guide with registration.
Any business that makes money through its website: e-commerce, SaaS, digital products, subscription businesses, lead generation, professional services, content businesses, and more. The guide covers 25 specific web-revenue business models.
The session covers the underlying framework that applies across all of them. Q&A time is where we get specific to your model. Come knowing your business type and your current metrics, because that's where the best questions come from.
The recording covers everything from the session itself. But live attendees get something extra, a bonus that won't be in the recording and won't be offered again. Details revealed on the day.
The Q&A is also worth showing up for. You can send questions in advance if you can't make it, but the live conversation tends to go places the recording can't.
Yes. The build portion of the session uses the guide directly. You'll open your business type section to find your North Star metric and your suggested diagnostic metrics, then add them to a Google Sheet during Part 3, the beginning of your actual dashboard.
The guide is included with your ticket and delivered immediately on registration. Download it before the session starts and have it open alongside the Zoom.
You'll be the first to know — and get a discount for being on the waitlist.
Coming in April · 12pm ET
One session, 60 minutes plus Q&A. You leave knowing how to read your metrics as a diagnostic system, and which part of your business to work on first.
Save My SpotNorth Star Dashboard Guide included · Recording sent to all registrants · Live via Zoom